Dr. Bart Meyers is a research engineer at Flanders Make vzw, a strategic research center for the manufacturing industry in Flanders, Belgium.
His research activities revolve around modelling and software engineering in the context of digitization and automation for Industry 4.0, such as digital twin technologies, internet of things, model-based systems engineering, variability modelling, and model-driven engineering. Before working at Flanders Make, he obtained his PhD in Computer Science at the University of Antwerp. In ASSISTANT, he and Flanders Make are leading the digital twin infrastructure research, which revolves around defining a knowledge graph.
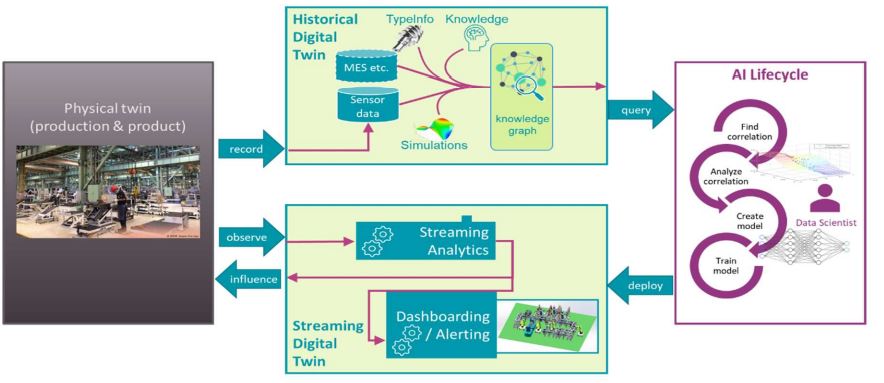
Bart: In ASSISTANT, the knowledge graph is the harbor of all knowledge related to your manufacturing process, which is an historical digital twin of your manufacturing system. It is the central point of information for the “historical digital twin” of the production system. The knowledge graph is a conceptual model of a knowledge domain, in this case your product’s design and its manufacturing process. Domain experts use such a knowledge graph to describe and solve problems related to the domain, using its real-world concepts, vocabulary, and relationships between these concepts. In ASSISTANT, the knowledge graph is the way to represent and find all knowledge about a manufacturing process that exists within an organization. It specifies what historical data exists, how it is related, from which sensors this data was collected, to which manufacturing process it was related, who was involved, what correlations may exist, what physics models are involved, which data experiments have been conducted in the past, what machines, sensors, products, operations exists and how they are used in the manufacturing process, etc. All this data, information and knowledge together form the historical digital twin of the manufacturing system. We use the term “historical” digital twin since this digital twin contains the historical information of the system, as opposed to the more traditional “streaming” digital twin that mirrors the live state based on streaming data of the system.
Félicien: What can the historical digital twin and knowledge graph be used for and what can it not be used for?
Bart: An organization can use the historical digital twin, using the knowledge graph as its interface, for obtaining insights in its production, performing what-if analysis, reuse or reproduce previously obtained insights, create AI algorithms, etc. These activities are all phases of what we like to call, the “AI lifecycle”. The AI lifecycle is the design process that starts from the raw data recorded by sensors and software, and results in a trained, validated and deployed streaming digital twin that brings value to the manufacturing process. In addition, it can spawn new AI lifecycles with the obtained insights. During some phases of the AI lifecycle, data scientists use the knowledge graph to extract the data, information, and knowledge they need to create such an AI solution. Such knowledge and insights exceed the common notion of a digital twin as a data-driven virtual counterpart of a system. In ASSISTANT, we therefore coin the term “Intelligent Twin” of the system when knowledge and insights are formally captured into the knowledge graph. In conclusion, we consider the Intelligent Twin and its knowledge graph to be a tool that helps the data scientist in parts of the AI lifecycle. What is it not intended for? It is not intended to specifically support creating software from the obtained insights (e.g., a dashboard application) or to be used by applications at runtime to obtain the data they need. It is first and foremost a tool to analyze your manufacturing system.
Félicien: What are the challenges and complexity of designing the knowledge graph?
Bart: We see three main challenges. One challenge is to find the right way to represent information and knowledge. Both ontologies and metamodeling can be used to formally describe this information, in such a way that it is machine-consumable.
Félicien: But, how can we model domain knowledge also in an intuitive way, such that querying the data/knowledge and inserting insights feels natural?
Bart: Suppose that we need to understand what adversely affects the quality of the manufactured products. A process engineer may have a certain “hunch” about a correlation/causality between certain environmental observations (fi. humidity, process parameters, …) during manufacturing and the end-of-line quality of the product. We need to add this tentative correlation to the knowledge graph. Later analysis based on historical data can refine this correlation. We need to introduce the experiments as well that were conducted during this analysis (both physical and data analysis) in the knowledge graph. In the ASSISTANT project, we will create a standardized format for such knowledge. A second challenge is designing the knowledge graph for your organization: what level of detail should be modelled in the knowledge graph? This depends on the questions that need to be solved and can thus change in the future. Do you intend to optimize production planning? This implies that the process steps, production hall layout and operator skills and their availability have to be modelled. Do you want to improve quality? Then quality control results and correlations to process steps will likely be of interest. In conclusion, the knowledge graph needs to be flexible, and able to evolve depending on the needs of an organization. A third challenge, which we specifically address in ASSISTANT, is how to represent different types of uncertainty.
Félicien: Interesting, how does the knowledge graph deal with uncertainties?
Bart: As explained, one purpose of the knowledge graph is to serve as the interface to the data, information, and knowledge. To draw correct conclusions, the data scientist often needs to consider stochastics and unknowns in the data. Examples of stochasticity are apparent in e.g., planning/scheduling optimization, where operator, machine or material availability, and orders are stochastic variables. They need to be modelled correctly using historical data. Going one step further, uncertain relationships need to be modeled. Since there often is a lot of knowledge about the physics of manufacturing, we can often model such relationships by using physics models of part of the production (e.g., thermodynamics of a curing oven, engineering mechanics of an assembly robot). These models contain uncertainty in their parameters, which can be characterized by “fine-grained learning” using machine learning methods. Even one more step further is “coarse-grained learning”, to characterize relationships between parameters in a production system. An example is the influence of certain machine settings on the end-of-line quality of a product as discussed above. To characterize this, domain knowledge needs to be used extensively. All these types of uncertainty need to be captured correctly in the knowledge graph to leverage this knowledge. Once modeled, uncertainties can be propagated (e.g., in a Bayesian network) to make predictions and perform what-if scenarios.
Félicien: What features does the knowledge graph bring to the ASSISTANT project?
Bart: First and foremost, better understanding of all domain concepts, and their relations. The knowledge graph makes data, information, and knowledge available in a unified way, at the knowledge domain level rather than the technical data level. This improves the understanding of and access to all input needed to perform an AI design lifecycle. The unified data model also allows relating different AI experiments by different project partners, since these experiments are performed on a single source of information. For the industrial partners, the knowledge base is large and collaboration within the organization is very intensive, so the above advantages could be very impactful. Of course, this still needs to be evaluated. For this, the industrial cases are a great starting point.
Félicien: What are the appropriate tools for visualizing a knowledge graph?
Bart: A knowledge graph is connected information. Therefore, it can best be visualized as a graph, where pieces of data and information are nodes, and relations are edges. The technologies we use have tools to visualize such models as a graph, such as WebVOWL for OWL ontologies. This is great for browsing the information. A data scientist will need to write queries that result in structured data, so an appropriate query interface is required as well. We have been using GraphQL and SPARQL for this in the past.
Félicien: Is there a difference between representing the knowledge graph with a UML diagram or with an ontology?
Bart: Both are valid ways to represent a knowledge graph. A UML diagram focuses more on strong typing and constraining all concepts in the domain. It provides a more natural integration in a software engineering process. An ontology focuses on common vocabulary, categorization, and relationships of concepts for large domains. In contrast to UML, it allows automated reasoning based on an openworld assumption, which maps better to reality. Within the project we have currently a preference towards ontologies as this is a familiar technology for many of the research partners. It also suits well the specific challenges for defining a knowledge graph we intend to address within the project, namely, how to model knowledge obtained from working with the data, and how to model uncertainties.
Félicien: Could you tell us a little more about ontologies?
Bart: Ontology engineering has been used in several disciplines to gain a better common understanding about a domain. In software engineering-related projects, RDF and OWL are de facto standards. These were popularized by the Semantic Web, which intends to make the Internet machine-readable by structuring its metadata. Other success stories are DBpedia, a formalization attempt for Wikipedia that allows querying its resources and links to related resources. Another example is the Google Knowledge Graph, which can extract specific information on search results in an infobox. In different areas, ontologies emerged that standardize the complete domain. Especially in life sciences this proved to be very successful (e.g., the Gene Ontology in bioinformatics, Plant Ontology in biology, etc.). In manufacturing, similar initiatives exist, like the Ontology for Sensors, Observations, Samples, and Actuators (SOSA). In ASSISTANT, we intend to use ontologies to explicitly model and standardize all knowledge of an organization, and to make it accessible.
Félicien: What is the future of knowledge graphs in an AI environment?
Bart: Currently, industry does not use knowledge graphs in AI within a manufacturing context. This severely limits the application of AI, as it is very hard to find the relevant data and information when conducting data analysis. In manufacturing companies, the amount of collected data is huge, as well as the amount of implicit knowledge about the data and the manufacturing processes that hide behind them. Especially in the manufacturing industry there is a lot of unleveraged domain knowledge, more than in other (purely data-driven) application domains. If you can capture and unify such extensive knowledge using a knowledge graph, we believe that this will be a key enabler to leverage your data.
Félicien: Finally, what do you think of the ASSISTANT project?
Bart: It is great to work together in such a diverse and international consortium. The ASSISTANT project brings together AI experts, software engineering researchers and manufacturing industries, to paint the complete picture of AI in manufacturing. All partners can contribute, as well as learn a lot from each other in this project.
Félicien: Thank you Bart.
Bart: Thank you for having me.